TOPEX/Poseidon and Jason (1,2,3) satellite altimeter data
(Institute of Ocean Sciences, Sidney, BC, Canada)
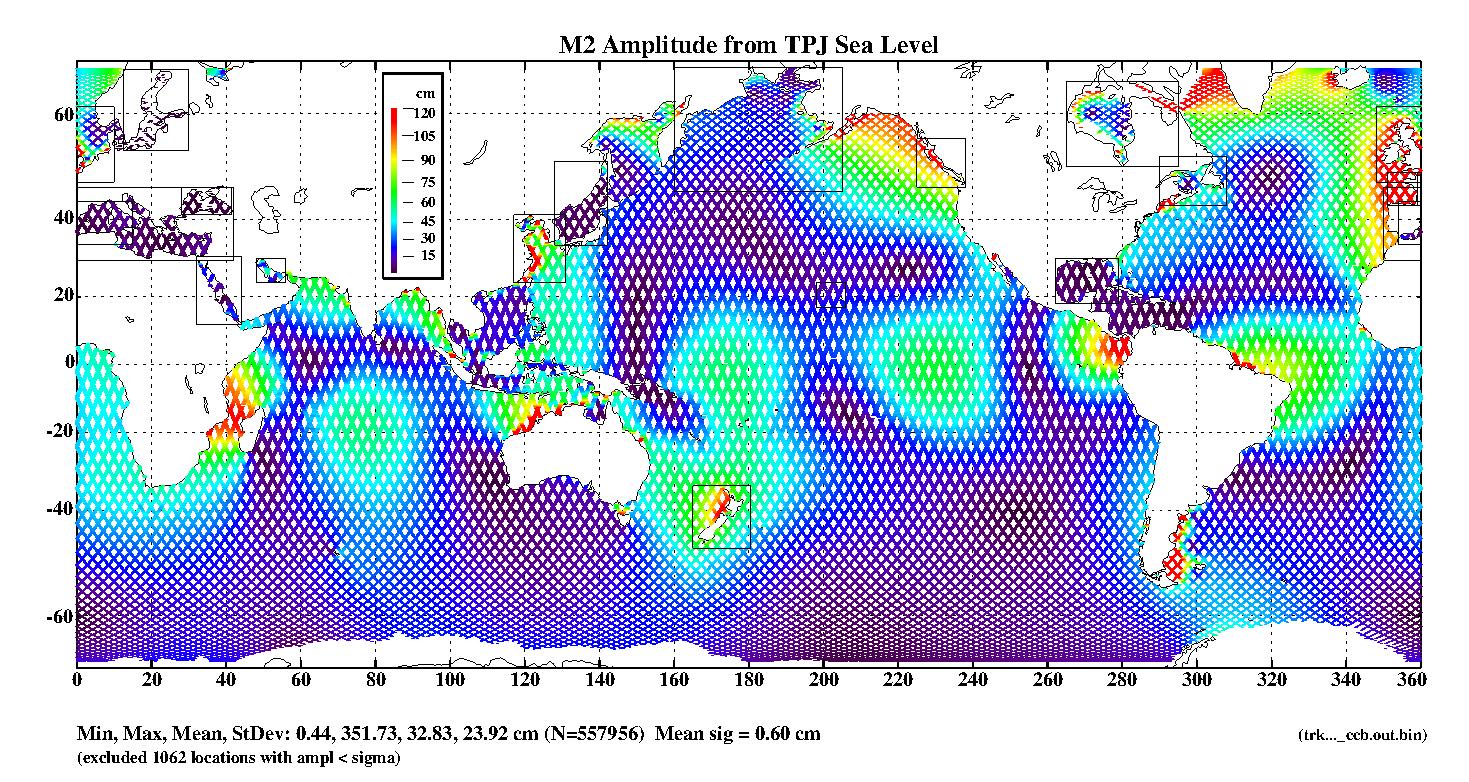
These web pages provide access to global and regional along-track TOPEX/Poseidon and Jason (TPJ)
satellite altimeter plots and data. Initially, we display tidal constituents, a linear sea level trend and two
climate indices PDO and MEI. These were calculated using Versatile Analysis VA of 25 years Sep.
1992 – Oct. 2017 of TPJ data in two detiding experiments. The details of VA are explained in the
references below, while the lists of analyzed constituents for the two experiments [cb and cv] are given
here. An example is shown in the plot below, which also shows 17 predefined geographical regions.
×
![]()
The user interface was designed to plot the amplitudes and phases of the constituents and climate indices, including the linear trend. This interface can be accessed here.
Referances:
Cherniawsky, J.Y., M.G.G. Foreman and W.R. Crawford, 2001. Ocean Tides from TOPEX/ POSEIDON sea level data. J. Atmos. Oceanic Tech. 18(4):649-664.
Foreman, M.G.G., J.Y. Cherniawsky and V.A. Ballantyne, 2009. Versatile harmonic tidal analysis: Improvements and applications. J. Atmos. Oceanic Tech. . 26: 806-817.
Cherniawsky, J.Y., M.G.G. Foreman, S.K. Kang, R. Scharroo and J.A. Eert, 2010. 18.6-year Lunar Nodal Tides from Altimeter Data. Cont. Shelf Res. 30(6): 575-587.
Cherniawsky, J.Y. and M.G.G. Foreman, 2016. The Rise and Fall of the Sea (as seen in satellite altimeter data). A seminar at the Institute of Ocean Sciences, Sidney, BC, Canada, Apr. 1, 2016.
[web site designed and written by Mathew Lewis, altimetry data processed by Josef Cherniawsky]